Google folder with Googles Slides and accompanying studnent journal files
- Subject:
- Science
- Material Type:
- Lesson Plan
- Provider:
- Provo City School District
- Date Added:
- 02/24/2023

Google folder with Googles Slides and accompanying studnent journal files

Construct an explanation that the gravitational force exerted by Earth causes objects to be directed downward, toward the center of the spherical Earth. Emphasize that "downward" is a local description depending on one’s position on Earth.

Ask questions to plan and carry out an investigation to determine cause and effect relationships of electric or magnetic interactions between two objects not in contact with each other. Emphasize how static electricity and magnets can cause objects to move without touching. Examples could include the force an electrically charged balloon has on hair, how magnet orientation affects the direction of a force, or how the distance between objects affects the strength of a force. Electrical charges and magnetic fields will be taught in Grades 6 through 8.

SFUSD's creative computing curriculum introduces computer science as a creative, collaborative, and engaging discipline to children in third through fifth grade.
Across 15-20 lessons at each grade level, students will learn about algorithms and programming, computing systems, the Internet, and impacts of computing, while developing strong practices and dispositions. Lessons are designed to be implemented in 45 to 60-minute periods approximately once per week.

This is an interactive 3rd grade lesson plan to reinforce 3.MD.5, 3.MD.6, and 3.MD.7 the concept of area. This lesson will most likely span over the course of a couple of days. Thumbnail "farm scene" by Christian Collins, Creative Commons license CC BY-SA 2.0.
![[3 ACTS] Nissan Girl Scout Cookies](https://img.oercommons.org/160x134/microsite-uen-prod/media/upload/materials/screenshots/materials-course-34250.png)
Students will work to use volume within a real world setting and compare/contrast the answers they find to the actual answer based on the context.

Starting the Winter Semester in 2024, Davis School District started piloting Chat for Schools, Skill Struck’s newest product that allows students to access AI tutors in a safe, controlled environment.

Learn about how pottery while throwing some digital clay.

Wakelet collection on 3D printing resources

This microcredential focuses on educators' consistent and effective use of Three Dimensional Assessments to inform instruction. Three Dimensional Assessments help demonstrate student understanding and proficiency to explain phenomena and solve design challenges. Assessments require students to apply the science and engineering practices (their skills) to reveal their understanding of disciplinary core ideas (the content) and crosscutting concepts. (the big ideas that connect all sciences.) Formative and summative assessments are both necessary to assess student understanding and performance.

Please note that this is an assessment tool and not a unit lesson plan. Performance expectation 5-LS2-1 is in two parts. As we were developing our formative assessment and summative task, we thought about teaching the learning performance sequentially and decided these spots would be a good place to check in for student understanding. Our thinking of a model is a representation and explanation of a phenomenon. You may want to choose the format your students create (flow chart, drawing, plus/delta, etc.) There are several templates in the formative and summative assessments that may help you and your class.

3rd Grade science unit about patterns in motion. This is a folder that includes a presentation on teaching 3D science and a lesson plan for 3.3.2.

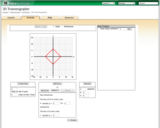
This lesson contains an applet that allows students to explore translations, reflections, and rotations.

This is a task from the Illustrative Mathematics website that is one part of a complete illustration of the standard to which it is aligned. Each task has at least one solution and some commentary that addresses important asects of the task and its potential use. Here are the first few lines of the commentary for this task: A small square is a square unit. What is the area of this rectangle? Explain. What fraction of the area of each rectangle is shaded blue? Name the frac...

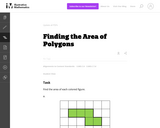
This is a task from the Illustrative Mathematics website that is one part of a complete illustration of the standard to which it is aligned. Each task has at least one solution and some commentary that addresses important asects of the task and its potential use. Here are the first few lines of the commentary for this task: Find the area of each colored figure. Each grid square is 1 inch long....

This is a task from the Illustrative Mathematics website that is one part of a complete illustration of the standard to which it is aligned. Each task has at least one solution and some commentary that addresses important aspects of the task and its potential use.

This is a task from the Illustrative Mathematics website that is one part of a complete illustration of the standard to which it is aligned. Each task has at least one solution and some commentary that addresses important aspects of the task and its potential use.

This is a task from the Illustrative Mathematics website that is one part of a complete illustration of the standard to which it is aligned. Each task has at least one solution and some commentary that addresses important aspects of the task and its potential use.

This is a task from the Illustrative Mathematics website that is one part of a complete illustration of the standard to which it is aligned. Each task has at least one solution and some commentary that addresses important asects of the task and its potential use. Here are the first few lines of the commentary for this task: Draw a purple pentagon Draw a blue shape with 3 line segments that is not a triangle. Draw an orange shape with 4 line segments that is not a quadrilat...

This is a task from the Illustrative Mathematics website that is one part of a complete illustration of the standard to which it is aligned. Each task has at least one solution and some commentary that addresses important asects of the task and its potential use. Here are the first few lines of the commentary for this task: Plot the following numbers on the number line: 80 328 791 1. Round each number to the nearest 100. How can you see this on the number line? 2. Round ea...