A color coded image of a QWERTY keyboard
- Subject:
- Career and Technical Education
- Material Type:
- Diagram/Illustration
- Provider:
- Canyons School District
- Date Added:
- 07/16/2024

A color coded image of a QWERTY keyboard

ZOOM guest Amy wants to be a meteorologist and volunteers at a weather observatory. In this adapted video segment, she shows us instruments used to predict the weather and describes how air pressure affects weather patterns.

The Knoster Model was created by Tim P. Knoster, Ed.D., professor at the McDowell Institute for Teacher Excellence in Positive Behavior Support in the College of Education at Bloomsburg University of Pennsylvania. The model is the result of years of rigorous behavioral science research and testing. The Knoster Model defines six elements that must be addressed to affect desired change. This model can be used as a resource and guide for applying theories of change at a systemic level.

Smithsonian resource. This collection of 5 videos visually tells the story of 5 labor leaders and how they worked to ensure safer working conditions, better wages, and how they brought forth state and federal legislation with their work.

To evaluate the trustworthiness of an unfamiliar website or online source, professional fact checkers practice lateral reading: They immediately leave the unknown site and open new tabs to search for what trusted sources say about it. The lateral reading classroom poster reminds students to implement this strategy when they come across an unfamiliar source. Note: A free educator account is required to access these materials.

In this video segment adapted from NOVA, scientist Mike Garcia draws lava samples at the foot of the active Kilauea volcano to see if it is related to its neighboring volcano, Mauna Loa.

This brief article describes the number sequence of Leonardo of Pisa (Fibonacci), and its connecton to the golden ratio and rectangle. Links to related topics and a link to a printable page are included.

This infographic presents eight distinct levels of scientific evidence arranged in a pyramid that reflects a spectrum of quality. Levels of evidence at the bottom are significantly more prone to error and bias than those at the top. The pyramid is reflective of the process of science itself: as initial hypotheses about a given question are tested, they are either disproven and discarded or they survive to be tested further. As more rigorous studies are completed, and as their results are compiled and analyzed, the picture painted by the evidence becomes clearer and more compelling.

This is the slide presentation used for the Leveraging Technology to Build Collective Efficacy session at UCET 2024. Attendees will learn how to define collective efficacy, examine current practices that build collective efficacy, and how to leverage technology to build collective efficacy.

This informational text explores Laura Gladstone's experience working at the IceCube telescope at the South Pole. She shares the clothing worn, food, what she did for fun, and how life there differs from what most of us know, including what one does NOT hear or see. The text is written at a grade two through grade three reading level. This version is a full-color PDF that can be printed, cut and folded to form a book. Each book contains color photographs and illustrations.

This informational text explores Laura Gladstone's experience working at the IceCube telescope at the South Pole. She shares the clothing worn, food, what she did for fun, and how life there differs from what most of us know, including what one does NOT hear or see. The text is written at a grade four through grade five reading level. This version is a full-color PDF that can be printed, cut and folded to form a book. Each book contains color photographs and illustrations.

This informational text explores Laura Gladstone's experience working at the Ice Cube telescope at the South Pole. She shares the clothing worn, food, what she did for fun, and how life there differs from what most of us know, including what one does NOT hear or see. The text is written at a kindergarten through grade one reading level. This version is a full-color PDF that can be printed, cut and folded to form a book. Each book contains color photographs and illustrations.

This is a virtual tour of the Lives bound together Exhibit at Mt. Vernon

What is it that distinguishes a living organism from a nonliving object? This collection of images presents examples that aren't as clear-cut as one might think, enticing students to question the meaning of life.

Emmy award-winning poet, Lucille Clifton, introduces and reads her poem, 'Turning,' about trying to be your own person and taking responsibility for your life.

In this adapted ZOOM video segment, cast members get hands-on in the recycling process by using old newspapers to make new paper.

In this video segment adapted from ZOOM, cast members make a seismometer and experiment with different ways to make it register movement.

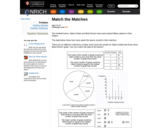
This data analysis activity requires students to read and interpret six written or graphical representations of data. Students must determine which graphs and analysis belong together. The data representations used include a pictograph, a circle graph, a frequency chart, a bar graph, and two written analyses including the terms mode, median, and mean for each data set. Included with the activity are teacher's notes, a hint, and the solution.

The Coherence Map from AchieveTheCore.org maps out the Common Core mathematics standards in a tree format. Select any math standard and see the prerequisite standards as well as what it is a prerequisite for. Each standard has attached tasks, progressions, and assessments.

Converting the visual to tactile experience, this activity let visually impaired students to learn and explore about our star, Sun, and its main characteristics.