
An article based on data and evidence that includes charts and information that can be analyzed statistically by students.
- Subject:
- Mathematics
- Material Type:
- Data Set
- Provider:
- FiveThirtyEight
- Date Added:
- 10/24/2022

An article based on data and evidence that includes charts and information that can be analyzed statistically by students.

Various records and documents for elections from 1960-Present.

Great resource for historical Utah elections data. Also provides a link to elections data for elections before 1960.
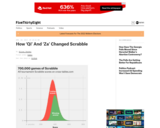
An article based on data and evidence that includes charts and information that can be analyzed statistically by students.
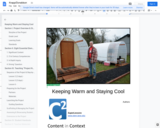
Consistent housing is a continual issue for our community, evidence of this is readily observable in the neighborhoods surrounding our classrooms. Over the course of 15 classroom hours, students will be exploring how they can insulate structures to protect from extreme hot and extreme cold using recycled and/or repurposed materials.
Students will make observations and collect data related to temperature. Student findings will be communicated through science journals, student generated models (charts, 3D structures, drawings, etc.).
Locate and use numeric, statistical, geospatial, and qualitative data sets, find data management templates, find data repositories to house your own data and find tools for data visualization.

Contains a list of all mining disasters that occur in the United States from the early 1800s to present. You can filter by State/year/city/accident/mining type, etc..

An article based on data and evidence that includes charts and information that can be analyzed statistically by students.

Population pyramids for countries and world regions. Includes historical data back to 1950.

Using an interactive map that links to data sheets, students learn about their state as they collect, organize, analyze, map, and graph a variety of information in “State Facts for Students.” They have the opportunity to examine data about kids their age, as well as a variety of other facts selected to appeal to young students.
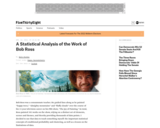
An article based on data and evidence that includes charts and information that can be analyzed statistically by students.

Student Goal Setting|Tracking|and Reflection

This interactive activity produced for Teachers' Domain shows the relationship between tectonic boundaries and the locations of earthquake events and volcanoes around the world.

US Census Bureau International Database houses key demograhpic data for most countries in the world. Data can be displayed numberically in tables, or graphically as population pyramids and line graphs.

The Quick Facts page allows teachers to access, explore, and compare basic Census data at multiple scales. As an example, compare Census data in the same table for the U.S.A (national scale), your state (sub-national scale), and your county or city (local scale). This data can be used to frame lessons on demographic patterns. Explore the data available and use what interests you and your students. This data can help develop several of the Foundational Geography Skills, as well as the Guiding Questions, found in the UEN standards document.
An article based on data and evidence that includes charts and information that can be analyzed statistically by students.

In this Utah's Online Library Update, Dani welcomes fellow PD trainer Matt on to tell us all about Scrible! He lets us know how to use it in the classroom and how Utah teachers can get it!

A. Assess and respond to needs of school library media personnel
B. Facilitate communication and collaboration amongst UELMA members and between UELMA members and the public
C. Provide and promote professional growth in a dynamic and changing environment
D. Develop and support performance standards for school library media personnel
E. Publicize the components and dimensions of school library media programs
F. Act as a state affiliate with AASL because of the two organizations’ consistent goals and purposes
G. Interact with local, state, and national organizations on issues related to school library media programs

Video clips from federal and regional agencies show scientists at work with tools used to collect data about the climate and weather. This article, from the free, online magazine Beyond Weather and the Water Cycle, will help students visualize the tools and how they are used in the atmosphere, at sea, and other hard-to-access locations.
An article based on data and evidence that includes charts and information that can be analyzed statistically by students.