
Explore current and past hurricanes using Google Earth.
- Subject:
- Physics
- Science
- Material Type:
- Interactive
- Provider:
- Provider Set:
- Google for Education
- Author:
- Google Earth
- Date Added:
- 08/30/2021

Explore current and past hurricanes using Google Earth.
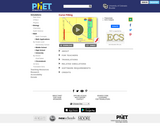
With your mouse, drag data points and their error bars, and watch the best-fit polynomial curve update instantly. You choose the type of fit: linear, quadratic, cubic, or quartic. The reduced chi-square statistic shows you when the fit is good. Or you can try to find the best fit by manually adjusting fit parameters.
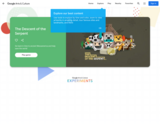
This fun, Zelda-like game allows players to explore ancient Mesoamerica and learn about Central American culture. Players learn about different items, ideas, and the culture of ancient Mesoamerican people.

A spreadsheet of a collection of 3 act tasks by standard.

In this Google Applied Digital Skills lesson, students will learn how to use Google tools to create and deliver a presentation to an audience

Learn what makes an exam, quiz, homework assignment, or practice exercises different types of assignments or assessments in Derivita. Learn how to add time limits, passwords, and more here.

Learn to assign the Derivita Student Tutorial Assignment, which shows students how to use Derivita and enter their answers.

Learn how to use Derivita's "Show Work" tool and view images of student's written work directly in a their submitted digital assignment.

Learn how to increase engagement and conduct real-time assessments right within your digital or in-person classroom with Derivita's SpotCheck.
Get to know your students by having them make a poster about themselves in Google Drawings.
Learn how to create Infographic using Google Drawings.
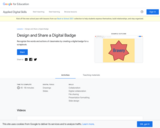
Studens will create a digital badge using Google Slides and Drawings

This lesson is written using the Launch, Explore, Summarize lesson plan format and includes a link to a chart to anticipate student strategies and monitor student strategies and thinking as they work through the problems. Tasks also include a recording sheet where applicable. They are meant to be used as ideas. Please make changes and adaptations as necessary for the students in your class. All of the ideas for the tasks in this bank are common picture book math problems or were created by UVU School of Education Faculty. If you use one of these tasks, please complete our Picture Book Task Survey so that we can learn more about your experience teaching, how students solve problems, and improve our Picture Book Task Bank.If you have any questions, comments, or concerns, please feel free to contact us at creativelearning@uvu.edu or nicole.gearing@uvu.edu.
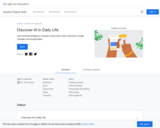
Artifical intelligence is becoming a larger part of daily life; this lesson helps users to explore it and its place in daily life.
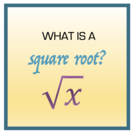
This is a lesson plan designed to help students construct the concept of a square root in relation to the area and side length of a square. Students will also connect the square root as the undoing of a number that has been squared. A key mathematical concept.
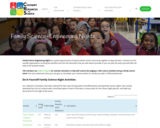
Each activity download has a list of contents with a brief description of each of the items, a lesson plan for the science night planner, and table top documents for the night of the event.These could be easily adapted to use in the classroom for preschoolers.

This lesson is written using the Launch, Explore, Summarize lesson plan format and includes a link to a chart to anticipate student strategies and monitor student strategies and thinking as they work through the problems. Tasks also include a recording sheet where applicable. They are meant to be used as ideas. Please make changes and adaptations as necessary for the students in your class. All of the ideas for the tasks in this bank are common picture book math problems or were created by UVU School of Education Faculty. If you use one of these tasks, please complete our Picture Book Task Survey so that we can learn more about your experience teaching, how students solve problems, and improve our Picture Book Task Bank.If you have any questions, comments, or concerns, please feel free to contact us at creativelearning@uvu.edu or nicole.gearing@uvu.edu.
Learn how to create Scientific Diagram using Google Drawings.

Learn about the newest updates to Google for Edu in this amazing short video.

Learn about ChromeOS Flex and new Google for Edu educator resources in this quick webinar.