A regional city has had lots of problems with gangs and violence …
A regional city has had lots of problems with gangs and violence over the years. The mayor, chief of police, and city council need your help. Data are available for the following: Incidents of violence, Homicides, Assaults, Regional Population (Census data), Unemployment, Unemployment rate, High School enrollment, High school drop outs, Graduation rate, Drop out rate, Prison population, Released on parole, Parole violations, Percent of parole violations, and Juvenile Inmates. Analyze and model these data to give the city a plan to reduce violence. After you complete your analysis and model, prepare a news release for the mayor briefly outlining your proposals that recommend a campaign strategy to curb the violence.
In this webinar, Dr. Mathes shares research on what is possible towards …
In this webinar, Dr. Mathes shares research on what is possible towards having students that no longer experience severe reading problems. She shares what we know in terms of research, including brain research, what interventions have been shown to be highly effective, and the ages at which we get the best effects for these kids.
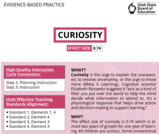
Curiosity is the urge to explain the unexpected, to resolve uncertainty, or …
Curiosity is the urge to explain the unexpected, to resolve uncertainty, or the urge to know more (Meta X Learning). Cognitive scientist Elizabeth Bonawitz suggests it “acts as a kind of filter you put over the world to help the mind decide what information to attend to. It’s a physiological response that helps drive action and decision-making to support learning.”
With a real context to the situations that the afrodescendant community continues …
With a real context to the situations that the afrodescendant community continues to live, so in this web portal you can find information about the dismantling of racism, political and economic development of blacks.
This resource is a Social Studies student activity that utilizes Utah's Online Library …
This resource is a Social Studies student activity that utilizes Utah's Online Library resources - specifically, World Book Encyclopedia - Behind the Headlines to help students learn about current events.
This set of lesson plans is designed to be used as a …
This set of lesson plans is designed to be used as a media literacy unit building on the Content Authenticity Initiative's "The Basics of Media Literacy" unit.
Facilitating student-to-student discussion provides students an opportunity to deliberate essential questions facing …
Facilitating student-to-student discussion provides students an opportunity to deliberate essential questions facing their community. This is an authentic practice to build and practice content knowledge, civic skills, and dispositions.
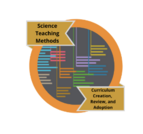
This microcredential represents educators' participation in effective curriculum creation, revision and adoption …
This microcredential represents educators' participation in effective curriculum creation, revision and adoption of SEEd standards. This stack of microcredentials fulfills one of the requirements of the pathway for the Secondary Science Endorsement.
In this ULEAD video series, state leaders in mathematics education describe the …
In this ULEAD video series, state leaders in mathematics education describe the elements that go into creating a successful mathematics program. This video focuses on curriculum, instruction, and assessment as part of Utah's guiding vision for K-12 mathematics.
The Word documents linked on this web page identify resources from the …
The Word documents linked on this web page identify resources from the NRICH collection that have been mapped to the strands (Number, Algebra, Shape and Space, and Handling Data) of the framework for teaching mathematics in the United Kingdom. These resources promote the development of content knowledge as well as mathematical thinking and problem-solving (process) skills. The stage 1 mapping is most useful for K-2, while the stage 2 document is for grades 3-6.
With your mouse, drag data points and their error bars, and watch …
With your mouse, drag data points and their error bars, and watch the best-fit polynomial curve update instantly. You choose the type of fit: linear, quadratic, cubic, or quartic. The reduced chi-square statistic shows you when the fit is good. Or you can try to find the best fit by manually adjusting fit parameters.
The purpose of this task is to introduce or reinforce the concept …
The purpose of this task is to introduce or reinforce the concept of a function, especially in a context where the function is not given by an explicit algebraic representation. Further, the last part of the task emphasizes the significance of one variable being a function of another variable in an immediately relevant real-life context. Instructors might prepare themselves for variations on the problems that the students might wander into (e.g., whether one person could have two home phone numbers) and how such variants affect the correct responses.
The purpose of this task is to introduce or reinforce the concept …
The purpose of this task is to introduce or reinforce the concept of a function, especially in a context where the function is not given by an explicit algebraic representation. Further, the last part of the task emphasizes the significance of one variable being a function of another variable in an immediately relevant real-life context.
No restrictions on your remixing, redistributing, or making derivative works. Give credit to the author, as required.
Your remixing, redistributing, or making derivatives works comes with some restrictions, including how it is shared.
Your redistributing comes with some restrictions. Do not remix or make derivative works.
Most restrictive license type. Prohibits most uses, sharing, and any changes.
Copyrighted materials, available under Fair Use and the TEACH Act for US-based educators, or other custom arrangements. Go to the resource provider to see their individual restrictions.