An article based on data and evidence that includes charts and information that can be analyzed statistically by students.
- Subject:
- Mathematics
- Material Type:
- Data Set
- Provider:
- FiveThirtyEight
- Date Added:
- 10/24/2022

An article based on data and evidence that includes charts and information that can be analyzed statistically by students.
An article based on data and evidence that includes charts and infomation that could be analyzed by students.
The Art of the Probable" addresses the history of scientific ideas, in particular the emergence and development of mathematical probability. But it is neither meant to be a history of the exact sciences per se nor an annex to, say, the Course 6 curriculum in probability and statistics. Rather, our objective is to focus on the formal, thematic, and rhetorical features that imaginative literature shares with texts in the history of probability. These shared issues include (but are not limited to): the attempt to quantify or otherwise explain the presence of chance, risk, and contingency in everyday life; the deduction of causes for phenomena that are knowable only in their effects; and, above all, the question of what it means to think and act rationally in an uncertain world. Our course therefore aims to broaden students’ appreciation for and understanding of how literature interacts with--both reflecting upon and contributing to--the scientific understanding of the world. We are just as centrally committed to encouraging students to regard imaginative literature as a unique contribution to knowledge in its own right, and to see literary works of art as objects that demand and richly repay close critical analysis. It is our hope that the course will serve students well if they elect to pursue further work in Literature or other discipline in SHASS, and also enrich or complement their understanding of probability and statistics in other scientific and engineering subjects they elect to take.
An article based on data and evidence that includes charts and information that can be analyzed statistically by students.
An article based on data and evidence that includes charts and information that can be analyzed statistically by students.
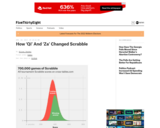
An article based on data and evidence that includes charts and information that can be analyzed statistically by students.

This lesson is the beginning of a unit about inference. It gives students the opportunity to use context clues and schema to make inferences in their reading. They will listen to a story and make their own inference about the ending.
Learn how to make inferences in literature, nonfiction and real life, and to support those inferences with strong, reliable evidence.
An inference is just coming to a logical conclusion from whatever evidence you have. It’s one of the most valuable thinking skills you can learn.
The ability to make inferences is one of the things that make a person what we call “smart.” And we say the person who can’t make inferences is “a little slow on the uptake,” right?, because other people figure out what’s going on more quickly than he or she does. We have to spell things out explicitly for that person.
So, when your teacher says he or she is going to help you learn how to make good inferences, imagine in your head that he or just said that you’re going to learn how to be smart today. You’re going to learn how to think, because, ultimately, that’s what making inferences is all about.

This issue of the free online magazine, Beyond Penguins and Polar Bears, explore how to use fossils and artifacts (scientific clues) to learn about the polar regions' past. Targeted literacy skills include making inferences, and using context clues to define new vocabulary.

This article highlights children's literature about fossils, dinosaurs, archaeology, and paleontology for use in the elementary classroom.
In this class, students use data and systems knowledge to build models of complex socio-technical systems for improved system design and decision-making. Students will enhance their model-building skills, through review and extension of functions of random variables, Poisson processes, and Markov processes; move from applied probability to statistics via Chi-squared t and f tests, derived as functions of random variables; and review classical statistics, hypothesis tests, regression, correlation and causation, simple data mining techniques, and Bayesian vs. classical statistics. A class project is required.
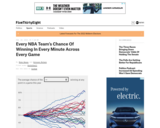
An article based on data and evidence that includes charts and information that can be analyzed statistically by students.

In this interactive lesson supporting literacy skills in U.S. history, students learn about the debate over slavery at the Constitutional Convention in 1787. Students explore the changing perception of slavery in the new United States and the ways in which the debate over slavery affected the content of the Constitution. During this process, they read informational text, learn and practice vocabulary words, and explore content through videos and engagement activities.
An article based on data and evidence that includes charts and information that can be analyzed statistically by students.
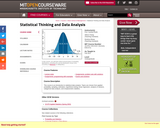
This course is an introduction to statistical data analysis. Topics are chosen from applied probability, sampling, estimation, hypothesis testing, linear regression, analysis of variance, categorical data analysis, and nonparametric statistics.

This site teaches High Schoolers how to Make Inferences and Justify Conclusions using statistics through a series of 99 questions and interactive activities aligned to 4 Common Core mathematics skills.

This article describes the processes of making inferences and using context clues to define unknown words. Links to web sites and articles provide background knowledge and instruction for teachers and students.
An article based on data and evidence that includes charts and information that can be analyzed statistically by students.
An article based on data and evidence that includes charts and information that can be analyzed statistically by students.

Animal shelters euthanize animals when no one adopts them. According to Joyce, the narrator of this segment, 26,000 dogs a year are picked up by Albuquerque Animal Services. To help find homes for the unwanted pets, Joyce, who is also a photographer, takes pictures of the dogs and posts the pictures on the Internet. She hopes when people see the dogs on the Internet they have an added incentive to come to the shelter to take them home. In this video segment from WILD TV, learn more about Joyce and her efforts to find homes for unwanted pets in Albuquerque. For more about animal shelters, see video segment "Animal Shelter".