This course discusses how to use algebra for a variety of everyday …
This course discusses how to use algebra for a variety of everyday tasks, such as calculate change without specifying how much money is to be spent on a purchase, analyzing relationships by graphing, and describing real-world situations in business, accounting, and science.
This course is also intended to provide the student with a strong …
This course is also intended to provide the student with a strong foundation for intermediate algebra and beyond. Upon successful completion of this course, you will be able to: simplify and solve linear equations and expressions including problems with absolute values and applications; solve linear inequalities; find equations of lines; and solve application problems; add, subtract, multiply, and divide various types of polynomials; factor polynomials, and simplify square roots; evaluate, simplify, multiply, divide, add, and subtract rational expressions, and solve basic applications of rational expressions. This free course may be completed online at any time. It has been developed through a partnership with the Washington State Board for Community and Technical Colleges; the Saylor Foundation has modified some WSBCTC materials. (Mathematics 001)
In this beginning algebra course, you'll learn about fundamental operations on real …
In this beginning algebra course, you'll learn about fundamental operations on real numbers, exponents, solving linear equations and inequalities, applications, functions, graphing linear equations, slope, and systems of linear equations. This course was created by Bossier Parish Community College as part of its MOOC series "Open Campus." NOTE: Open Campus courses are non-credit reviews and tutorials and cannot be used to satisfy requirements in any curriculum at BPCC. (Beginning Algebra Course by Bossier Parish Community College is licensed under a Creative Commons Attribution-NonCommercial-NoDerivatives 4.0 International License. Based on a work at http://bpcc.edu/opencampus/index.html.)
This course is designed to take the concepts you learn in developmental …
This course is designed to take the concepts you learn in developmental math to expand your knowledge of algebra. This course will focus on two major algebraic concepts to learn - how to SOLVE equations and how to GRAPH equations. Throughout this course you will be challenged to recall ALL of your prior knowledge of operations of real numbers as well as your knowledge related to solving and graphing linear equations (which you should have already mastered from developmental algebra). You will use this prior knowledge to expand on learning the following objectives: solving linear & rational equations. operations of complex numbers, solving quadratic equations, solving radical & polynomial equations, solving equations with rational exponents, solving linear and compound inequalities, solving absolute value equations and inequalities, graphing linear equations & slope, understanding concepts of domain, range and function notation, finding compositions of functions, finding inverses of functions, solving and graphing exponential and logarithmic equations, solving and graphing systems of equations and inequalities, and graphing conics.
*Open Campus courses are non-credit tutorials and cannot, in and of themselves, be used to satisfy degree requirements at Bossier Parish Community College (BPCC). (College Algebra Course by Bossier Parish Community College is licensed under a Creative Commons Attribution-NonCommercial-NoDerivatives 4.0 International License. Based on a work at http://bpcc.edu/opencampus/index.html.)
With your mouse, drag data points and their error bars, and watch …
With your mouse, drag data points and their error bars, and watch the best-fit polynomial curve update instantly. You choose the type of fit: linear, quadratic, cubic, or quartic. The reduced chi-square statistic shows you when the fit is good. Or you can try to find the best fit by manually adjusting fit parameters.
Density and Composition of Pennies Lab Interactive Google Document, in which students …
Density and Composition of Pennies Lab
Interactive Google Document, in which students easily make graphs and manipulate images by dragging and dropping points. Students make their own copy of the google doc in their student drive, edit it, and share/submit to teacher.
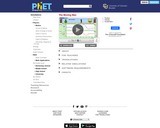
Learn about graphing polynomials. The shape of the curve changes as the …
Learn about graphing polynomials. The shape of the curve changes as the constants are adjusted. View the curves for the individual terms (e.g. y=bx ) to see how they add to generate the polynomial curve.
Learn about graphing polynomials. The shape of the curve changes as the …
Learn about graphing polynomials. The shape of the curve changes as the constants are adjusted. View the curves for the individual terms (e.g. y=bx ) to see how they add to generate the polynomial curve.
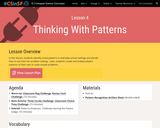
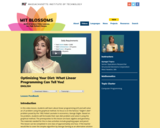
In this lesson, students identify visual patterns in everyday school settings and …
In this lesson, students identify visual patterns in everyday school settings and decide how to use them for problem solving. Later, students create and analyze playful patterns of their own to solve simple problems.
This article discusses how the study of weather can meet the NCTM …
This article discusses how the study of weather can meet the NCTM Data Analysis and Probability standard. Links to lessons for grades K-2 and 3-5 are provided.
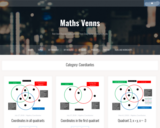
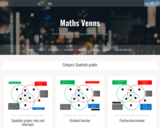
Use these Venn diagrams to get students to reason and deepen their …
Use these Venn diagrams to get students to reason and deepen their understanding of the coordinate plane. Use the Venns that do not focus on quadrant one as extensions for those accelerated students.
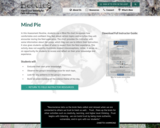
In this Assessment Routine, students use a Mind Pie chart to express …
In this Assessment Routine, students use a Mind Pie chart to express how comfortable and confident they feel about certain topics and activities they will encounter during the field experience. The chart provides the instructor with some information about the group, which they can use to inform their instruction. It also gives students an idea of what to expect from the field experience. This activity does not explicitly illuminate student misconceptions, rather, it serves as an opportunity for students to access and reflect on their prior knowledge and experience.
Learn about position, velocity, and acceleration graphs. Move the little man back …
Learn about position, velocity, and acceleration graphs. Move the little man back and forth with the mouse and plot his motion. Set the position, velocity, or acceleration and let the simulation move the man for you.
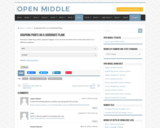
Open Middle tasks provide opportunities for student to approach a mathematical task …
Open Middle tasks provide opportunities for student to approach a mathematical task using different strategies and representations. They can be used as a warm-up/closing activity, as a formative assessment, or to facilitate discourse and discussion and get insite into student thinking and problem solving. These tasks provide a great opportunity for student to engage with the Standards for Mathematical Practice.
In this video lesson, students will learn about linear programming (LP) and …
In this video lesson, students will learn about linear programming (LP) and will solve an LP problem using the graphical method. Its focus is on the famous "Stigler's diet" problem posed by the 1982 Nobel Laureate in economics, George Stigler. Based on his problem, students will formulate their own diet problem and solve it using the graphical method. The prerequisites to this lesson are basic algebra and geometry. The materials needed for the in-class activities include graphing paper and pencil. This lesson can be completed in one class of approximately one hour. If the teacher would like to cover the simplex algorithm by George Dantzig as an alternative solution method, an additional whole class period is suggested.
This learning video presents an introduction to graph theory through two fun, …
This learning video presents an introduction to graph theory through two fun, puzzle-like problems: ''The Seven Bridges of Konigsberg'' and ''The Chinese Postman Problem''. Any high school student in a college-preparatory math class should be able to participate in this lesson. Materials needed include: pen and paper for the students; if possible, printed-out copies of the graphs and image that are used in the module; and a blackboard or equivalent. During this video lesson, students will learn graph theory by finding a route through a city/town/village without crossing the same path twice. They will also learn to determine the length of the shortest route that covers all the roads in a city/town/village. To achieve these two learning objectives, they will use nodes and arcs to create a graph and represent a real problem.
No restrictions on your remixing, redistributing, or making derivative works. Give credit to the author, as required.
Your remixing, redistributing, or making derivatives works comes with some restrictions, including how it is shared.
Your redistributing comes with some restrictions. Do not remix or make derivative works.
Most restrictive license type. Prohibits most uses, sharing, and any changes.
Copyrighted materials, available under Fair Use and the TEACH Act for US-based educators, or other custom arrangements. Go to the resource provider to see their individual restrictions.