This lesson contains a series of activities you can use to help …
This lesson contains a series of activities you can use to help students familiarize themselves with Create Performance Task, how it is scored, and some example tasks provided by the College Board.
Students review the Submission Requirements and Scoring Guidelines for the Create PT. Subsequently they review three example scored Create PT submissions with commentary to better understand how the Submission Requirements and Scoring Guidelines are used together. In a wrap-up conversation they identify a piece of advice, a "gotcha", and a remaining question they have about the Create PT.
Note: Much the sample tasks, scores, and commentary on scoring shared in this lesson come directly from the College Board. Code.org's commentary is noted where applicable.
This lesson uses the [r create-pt-survival-guide] as the backbone for a series …
This lesson uses the [r create-pt-survival-guide] as the backbone for a series of activities to ramp up to doing the actual Create PT. It contains activities to help students understand the algorithm and abstraction requirements of the task, as well as activities to help them narrow down and brainstorm ideas for their actual project.
The lesson concludes by providing students with resources to make a plan to complete the task staring in the next lesson.
It is finally time for students to take on the Create Performance …
It is finally time for students to take on the Create Performance Task. For a total of 12 class hours, students should work on their projects with only types of teacher support allowed (essentially: Advise on process, don’t influence or evaluate ideas). Students may also work with a collaborative partner in *in development of their program* - written responses must be done on their own.
The lesson includes reminders about how you can interact with students while they are working on their projects, and suggestions about time line. The Create PT requires a minimum of 12 hours of class time. At the end, students will submit their program code, program video, and written responses through their AP digital portfolio.
In this kickoff to the Data Unit, students begin thinking about how …
In this kickoff to the Data Unit, students begin thinking about how data is collected and what can be learned from it. To begin the lesson, students will take a short online quiz that supposedly determines something interesting or funny about their personality. Afterwards they will brainstorm other sources of data in the world around them, leading to a discussion of how that data is collected. This discussion motivates the introduction of the Class Data Tracker project that will run through the second half of this unit. Students will take the survey for the first time and be shown what the results will look like. To close the class, students will make predictions of what they will find when all the data has been collected in a couple weeks.
This is a pretty fun lesson that has two main parts. First …
This is a pretty fun lesson that has two main parts. First students warm up by reflecting on the reasons data visualizations are used to communicate about data. This leads to the main activity in which students look at some collections of (mostly bad) data visualizations, rate them, explain why a good one is effective, and also suggest a fix for a bad one.
In the second part of class students compare their experiences and create a class list of common faults and best practices for creating data visualizations. Finally, students review and read the first few pages of **Data Visualization 101: How to design charts and graphs** to see some basic principles of good data visualizations and see how they compare with the list the class came up with.
Now that students have had the chance to see and evaluate various …
Now that students have had the chance to see and evaluate various data visualizations, they will learn to make visualizations of their own. This lesson teaches students how to build visualizations from provided datasets. The levels in Code Studio provide a detailed walkthrough of how to use Google Sheets to create several different kinds of charts. While this lesson focuses on the Google Sheets tool, other tools may be substituted at the teacher’s discretion, and MS Excel support is coming soon to the lesson.
The main activity teaches students to build different chart types (scatter, line, and bar charts) from a single data set. It should be emphasized to students that the purpose of this lesson is to explore and experiment with creating different types of visualizations, not to build the perfect chart. Students will have a chance to create and customize their own charts. At the end of class, students compare their custom visualizations with those of their classmates.
In this lesson, students will collaboratively investigate some datasets and use visualization …
In this lesson, students will collaboratively investigate some datasets and use visualization tools to “discover a data story.” The lesson assumes that students know how to use some kind of visualization tool - in the previous lesson we used the charting tools of a basic spreadsheet program. Students should be working with a partner but without much teacher hand-holding. Most of the time should be spent with students poking around the data and trying to discover connections and trends using data visualization tools. It is up to them to discover a trend, make a chart, and accurately write about it.
In this lesson, students begin working with the data that they have …
In this lesson, students begin working with the data that they have been collecting since the first lesson of the chapter in the class "data tracker." They are introduced to the first step in analyzing data: cleaning the data. Students will follow a guide in Code Studio, which demonstrates the common techniques of filtering and sorting data to familiarize themselves with its contents. Then they will correct errors they find in the data by either hand-correcting invalid values or deleting them. Finally they will categorize any free-text columns that were collected to prepare them for analysis. This lesson introduces many new skills with spreadsheets and reveals the sometimes subjective nature of data analysis.
In this lesson students learn how create their own summary tables from …
In this lesson students learn how create their own summary tables from raw data. A summary table typically represents one or more aggregations (groupings of items) and computations that are performed on the raw dataset. In most spreadsheet programs, a summary table is called a pivot table. In the lesson, students learn how to make pivot tables in Google Sheets using a provided dataset. Then students turn to the data they’ve collected as a class and, with their partner, use pivot tables to investigate it further.
For this Practice PT students will analyze the data that they have …
For this Practice PT students will analyze the data that they have been collecting as a class in order to demonstrate their ability to discover, visualize, and present a trend or pattern they find in the data. Leading up to this lesson, students will have been working in pairs to clean and summarize their data. Students should complete this project individually but can get feedback on their ideas from their data-cleaning partner.
**Note**: This is NOT the official AP® Performance Task that will be submitted as part of the Advanced Placement exam; it is a practice activity intended to prepare students for some portions of their individual performance at a later time.
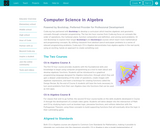
Code.org has partnered with Bootstrap to develop a curriculum which teaches algebraic …
Code.org has partnered with Bootstrap to develop a curriculum which teaches algebraic and geometric concepts through computer programming. The two ten hour courses from Code.org focus on concepts like order of operations, the Cartesian plane, function composition and definition, and solving word problems. Or visit Bootstrap to explore their longer Bootstrap:1 and Bootstrap:2 courses which teach more mathematical and programming concepts. By shifting classwork from abstract pencil-and-paper problems to a series of relevant programming problems, Code.org's CS in Algebra demonstrates how algebra applies in the real world, using an exciting, hands-on approach to create something cool.
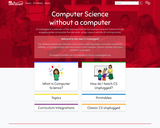
CS Discoveries is an introductory computer science course that empowers students to …
CS Discoveries is an introductory computer science course that empowers students to create authentic artifacts and engage with computer science as a medium for creativity, communication, problem solving, and fun.
This lesson is to teach the problem-solving strategy using the CUBES acronym. …
This lesson is to teach the problem-solving strategy using the CUBES acronym. The students will use digital photos to create real-life story problems of their own and practice using the CUBES strategy to solve the problems they create as well as those of their peers.
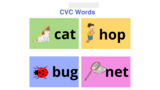
This lesson plan uses Nearpod to teach about CVC words, short vowel …
This lesson plan uses Nearpod to teach about CVC words, short vowel sounds, and beginning/middle/ending sounds. The lesson includes learning videos, self evaluation tasks, interactive slides, and group collaboration. Great resource for teaching and practicing CVC words!
Students will learn about CVC words and interact with online activities. This …
Students will learn about CVC words and interact with online activities. This lesson starts about with a pre-assessment and then goes into the lesson and activities that support understanding and reading CVC words.
Join our panelists Thomas Duckenfield, Trustee for the Nomini Hall Slave Legacy …
Join our panelists Thomas Duckenfield, Trustee for the Nomini Hall Slave Legacy Project, Dr. Andrew Levy, Author of The First Emancipator: The Forgotten Story of Robert Carter, the Founding Father Who Freed His Slaves, and Gerry Underdown, Actor Interpreter with Colonial Williamsburg, as they discuss those that physically built the nation, those that built the nation with enlightened ideas, and their combined lasting legacy. This is part of our national conversation series, US: Past, Present, Future. Learn more at colonialwilliamsburg.org/us.
No restrictions on your remixing, redistributing, or making derivative works. Give credit to the author, as required.
Your remixing, redistributing, or making derivatives works comes with some restrictions, including how it is shared.
Your redistributing comes with some restrictions. Do not remix or make derivative works.
Most restrictive license type. Prohibits most uses, sharing, and any changes.
Copyrighted materials, available under Fair Use and the TEACH Act for US-based educators, or other custom arrangements. Go to the resource provider to see their individual restrictions.