This professional development article identifies resources that show young learners (K-grade 5) …
This professional development article identifies resources that show young learners (K-grade 5) how scientists study Earth's climate and make predictions. The online lessons either allow students to collect and analyze data or learn about tools and technologies that make data collection possible. The lessons are aligned with national content standards for science education. The article appears in the free, online magazine Beyond Weather and the Water Cycle, which examines the recognized essential principles of climate literacy and the climate sciences for elementary teachers and their students.
Developed by the U.S. Department of Education and Transparency Center, this tool …
Developed by the U.S. Department of Education and Transparency Center, this tool is geared toward helping students find a college that is a good fit for them.
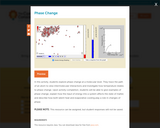
This interactive activity for grades 8-12 features eight models that explore atomic …
This interactive activity for grades 8-12 features eight models that explore atomic arrangements for gases, solids, and liquids. Highlight an atom and view its trajectory to see how the motion differs in each of the three primary phases. As the lesson progresses, students observe and manipulate differences in attractions among atoms in each state and experiment with adding energy to produce state changes. More advanced students can explore models of latent heat and evaporative cooling. This item is part of the Concord Consortium, a nonprofit research and development organization dedicated to transforming education through technology.
Research indicates that most standards documents articulate far more content than can …
Research indicates that most standards documents articulate far more content than can be taught in the time available to K–12 teachers. In response, analysts at Marzano Resources sought to identify, as objectively as possible, a focused set of critical concepts for each K–12 grade level in the content areas of English language arts (ELA), mathematics, science, and social studies.
"Do plants from different climates show differences in chemical diversity as a …
"Do plants from different climates show differences in chemical diversity as a result of herbivory defense?" Answer this question with your abiltiy to work with statistics.
"Does the amount of time lady beetles spend at freezing temperatures affect …
"Does the amount of time lady beetles spend at freezing temperatures affect how long it takes for them to wake up from a chill coma?" Use this data nugget and your graphing skills to determine a solution.
No restrictions on your remixing, redistributing, or making derivative works. Give credit to the author, as required.
Your remixing, redistributing, or making derivatives works comes with some restrictions, including how it is shared.
Your redistributing comes with some restrictions. Do not remix or make derivative works.
Most restrictive license type. Prohibits most uses, sharing, and any changes.
Copyrighted materials, available under Fair Use and the TEACH Act for US-based educators, or other custom arrangements. Go to the resource provider to see their individual restrictions.