This task uses the same situation to explore different concepts of probability theory.
- Provider:
- Illustrative Mathematics
- Date Added:
- 06/22/2022

This collection contains highly recommended Secondary Mathematics IIIlessons, activities, and other resources from the eMedia library.

This task uses the same situation to explore different concepts of probability theory.
In this task students are asked to analyze a function and its inverse when the function is given as a table of values. In addition to finding values of the inverse function from the table, they also have to explain why the given function is invertible.

This task completes the line of reasoning of Random Walk III in a situation where the numbers become too large to calculate and so abstract reasoning is required in order to compare the different probabilities. It is intended for instructional purposes only with a goal of understanding how to calculate and compare the combinatorial symbols.

In athletics, one of the possible distances to run is 15,000 meters or 15k (in the picture you see the leader in an annual 15k - race in the Netherlands. Please see Wikipedia article below). For this type of run, 15k on a street track, there is a world record, as there are records for all other distances that are run in athletics (e.g. the marathon). In such a race, the organizing committee will usually pay a significant amount of money as a bonus to the winner if he or she succeeds in setting a new world record. These amounts of money can get quite large in order to attract top runners: in the race shown in the picture there was a 25,000 euro bonus if the winner succeeded in improving the 15k world record – which, by the way, he (un)fortunately did not achieve. Had he done so, there would have been a major financial problem for the organizing committee, since they had not purchased any insurance.
This task examines the ways in which the plane can be covered by regular polygons in a very strict arrangement called a regular tessellation. The goal of the task is to use algebra in order to understand which tessellations of the plane with regular polygons are possible.
This lesson unit is intended to help educators assess how well students understand conditional probability.
This lesson unit is intended to help educators assess how well students are able to understand what the different algebraic forms of a quadratic function reveal about the properties of its graphical representation.

The task is intended to address standards regarding sample space, independence, probability distributions and permutations/combinations.
The goal of this task is to complete the square in a quadratic expression in order to find its minimum or maximum value.
The goal of this task is to manipulate equations in order to solve for a specified variable.
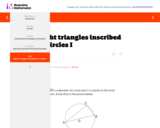
This task provides a good opportunity to use isosceles triangles and their properties to show an interesting and important result about triangles inscribed in a circle with one side of the triangle a diameter: the fact that these triangles are always right triangles is often referred to as Thales' theorem
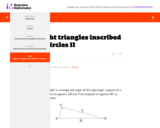
This task is designed to address the standard "Identify and describe relationships among inscribed angles, radii, and chords."

There are several Roller Coaster rating/ranking sites online that, while taking some objective measures into account, heavily rely on subjective input to determine the rating or ranking of a particular roller coaster (e.g., an "excitement"or "experience" score of an "expert" rider to measure "thrill").
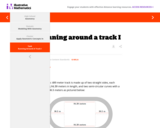
This task uses geometry to find the perimeter of the track.
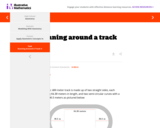
The goal of this task is to model a familiar object, an Olympic track, using geometric shapes.
This task is designed to help students use the mean and standard deviation of a data set to fit it to a normal distribution and to estimate population percentages. They should also recognize that there are data sets for which such a procedure is not appropriate, and use calculators, spreadsheets, and tables to estimate areas under the normal curve.

This task is an example of applying geometric methods to solve design problems and satisfy physical constraints.
The goal of this task is to apply dilations to a triangle in the coordinate plane.

This task is designed to help students understand statistics as a process for making inferences about population parameters based on a random sample from that population.

Consider a school where most of the students are from rural areas so they must be bused. The buses might pick up all the students and go to the elementary school and then continue from that school to pick up more students for the high school.
A clear alternative would be to have separate buses for each school even though they would need to trace over the same routes. There are, of course, restrictions on time (no student should be in the bus more than an hour), drivers, equipment, money and so forth.
How can you set up school bus routes to optimize budget dollars while balancing the time on the bus for various school groups? Build a mathematical model that could be used by various rural and perhaps urban school districts. How would you test the model prior to implementation? Prepare a short article to the school board explaining your model, its assumptions, and its results.