Students articulate their thoughts about the ethical issues related to population reaching …
Students articulate their thoughts about the ethical issues related to population reaching seven billion and consider the opinions of their classmates. Note: A free account login is required to access this resource.
This article aligns the concepts of Essential Principle 2 of the Climate …
This article aligns the concepts of Essential Principle 2 of the Climate Sciences to the K-5 content standards of the National Science Education Standards. The author also identifies common misconceptions about heat and the greenhouse gases effect and offers resources for assessing students' understanding of interactions among components of the Earth system. This article continues the examination of the climate sciences and climate literacy on which the online magazine Beyond Weather and the Water Cycle is structured.
This lesson was created by the Census Bureau and has students compare …
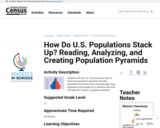
This lesson was created by the Census Bureau and has students compare various population pyramids. It has students look at changes in population over time, changes in population by location, and changes in populations due to natural disasters. it also has students explore policy issues related to population make-up. Ultimately students then create a population pyramid for a state. While the site lists this lesson for 12th graders, taking 90 minutes I would also recommend it for 9th grade geography noting that it does take them longer than 90 minutes.
Listed Description: Students will use U.S. Census Bureau data to learn how population pyramids describe population structures and to calculate age range population percentages for a selected state that will help them create a population pyramid.
This textbook introduces students to the basic concepts, trends, perspectives and interconnections …
This textbook introduces students to the basic concepts, trends, perspectives and interconnections of global society. Through readings, discussions, videos, webcasts and other activities, students examine the interdependence of people around the world and global issues that affect these relationships. It will provide an overview of the history and theoretical approaches that have created a global society through topics such as global politics, human rights, the natural environment, population, disease, gender, information technology, war and peace. This is a required course for the Global Studies Emphasis.
This course introduces students to the basic concepts, trends, perspectives and interconnections …
This course introduces students to the basic concepts, trends, perspectives and interconnections of global society. Through readings, discussions, videos, webcasts and other activities, students examine the interdependence of people around the world and global issues that affect these relationships. It will provide an overview of the history and theoretical approaches that have created a global society through topics such as global politics, human rights, the natural environment, population, disease, gender, information technology, war and peace. This is a required course for the Global Studies Emphasis.
Briefly reviews man's historical development in the area located within the present …
Briefly reviews man's historical development in the area located within the present borders of the state of Utah. Investigates contemporary social issues shaping the destiny of the state including: population growth, industrial and economic development, recreational enhancement, and political activism.
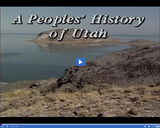
The history of Population growth 1910-1920 is summarized in this media item …
The history of Population growth 1910-1920 is summarized in this media item extracted from the 20-part video series A PEOPLES' HISTORY OF UTAH, written and hosted by Dean L. May, PhD (University of Utah). The series provides a sweeping view of Utah's past, from its earliest known desert beginning--from its prehistory, to the pioneer era, to the transformation from territory to state, to its critical role in the world war years and beyond.
The history of Mormons to non-Mormons population is summarized in this media …
The history of Mormons to non-Mormons population is summarized in this media item extracted from the 20-part video series A PEOPLES' HISTORY OF UTAH, written and hosted by Dean L. May, PhD (University of Utah). The series provides a sweeping view of Utah's past, from its earliest known desert beginning--from its prehistory, to the pioneer era, to the transformation from territory to state, to its critical role in the world war years and beyond.
Population Explosion is a computer simulation which allows students to manipulate factors …
Population Explosion is a computer simulation which allows students to manipulate factors to see what happens over time to a population of sheep within an enclosed field. As the simulation runs, a graph shows the dynamic relationship between the sheep population size and their primary food resource, grass. Students can control factors such as initial number of sheep, grass regrowth rate, gain from food, and birthrate. Predation is represented by a reaper button which may also be controlled. The speed of the simulation can be set so that students can see more clearly what happens over time, or collect data more quickly, depending on how fast the simulation runs. Directions and a suggested simulation sequence are provided along with prompts so that students can pause and consider their results. A space within the simulation is provided for students to record observations and answers to the prompts. For each step in this suggested sequence, students take a snapshot of graphs they have created and store them in an album. At the end of the activity analysis questions help students connect the activity to wild populations. An optional extension exercise is also suggested.
This 14-minute video lesson shows how to estimate the probability that the …
This 14-minute video lesson shows how to estimate the probability that the true population mean lies within a range around a sample mean .[Statistics playlist: Lesson 40 of 85]
No restrictions on your remixing, redistributing, or making derivative works. Give credit to the author, as required.
Your remixing, redistributing, or making derivatives works comes with some restrictions, including how it is shared.
Your redistributing comes with some restrictions. Do not remix or make derivative works.
Most restrictive license type. Prohibits most uses, sharing, and any changes.
Copyrighted materials, available under Fair Use and the TEACH Act for US-based educators, or other custom arrangements. Go to the resource provider to see their individual restrictions.