Practice finding rates and determine if there is a slope uisng this data nugget.
- Subject:
- Mathematics
- Material Type:
- Activity/Lab
- Data Set
- Lesson Plan
- Provider:
- Data Nuggets
- Author:
- Data Nuggets
- Date Added:
- 10/24/2022

Practice finding rates and determine if there is a slope uisng this data nugget.
Answer this question using your ability to find the mean from the data. "How does the elevation of the marsh organ pipe, relative to mean sea level, affect plant growth?"

Is mud more than just wet dirt? Review this data and look for any trends to determine relationships between organic matter and phosphorus in different muds.

Use this data to determine an answer to the question, "How have sea level and saltmarsh sparrow numbers changed over time?"

Why do insects shoot their frass? Is it to deter their enemies? What do you think after examining this set of data?

What affects do different drugs have on spiders and their abilities to make their webs? Students look at the area of different webs to predict an answer to this question. The raw data is available for this experiment.
Does the temperature affect plants flowering? Use this data to determine the answer to this question while looking for patterns and making predictions. Students can interact with the raw data from this experiement.

Have students learn about scatterplots, linear regression and predictions in this classic example of determining how the number of species has changed over time.

What kind of gasses are in the soil and what do they emit? Study and interpret this data by creating scatterplots and trend lines.
Practice finding the mean while looking for an answer to the question, "Is there any evidence that mudsnails are causing the decline in fish populations through their effects on invertebrate populations?"
Does the diameter of a tree determine how suseptable it is to a fungus? Use this data to create a scatterplot and see if there is any correlation.
What does a male stickleback fish do to attract a female? Review this data to find out.

Discuss independent and independent variables as you learn about relationships between coral, algae and urchins. Look for patterns and determine if there are any relationships between these different sea creatures by reading or creating your own graphical representations.
This is a very simple overview and lesson on electricity. This lesson can be altered to fit the need of your class. Use the pieces that work for you.

This ESRI StoryMap examines 2020 Census data using a variety of scales, examples, maps, and data

This project will be focused on designing, constructing and evaluating different containers to determine the optimal design for heat retention. After students have constructed their designs and collected and shared data, students will evaluate the class data to create an optimal design for our culminating event: warming ooey, gooey chocolate chip cookies to perfection! Through this activity, students will learn about energy transfer, engineering design process, data collection, graphing, rate of change, optimization, surface area and proportions. The students will test the effectiveness of their design using Vernier Probes to gather quantitative data and graphing the rate of temperature change. They will then create a poster presentation to share their data to the class. Students will use their mathematical skills to quantitatively analyze the strength and weaknesses of their designs while enjoying some delicious, toasty, warm cookies.
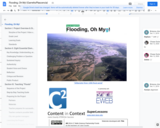
This is a 21 day unit on the topic of floods. Students will plan and prepare for what might happen in the event of a flood in our area. We have had floods in the past that have affected the Walterville School, its campus, and the surrounding areas. Using this as a springboard, students will discuss the effects of flooding, do research and interview family members who have experienced flooding, and then discuss possible ways to prevent significant damage on the buildings and surrounding areas. They will then design a barrier that could protect an area from damage for a period of time. Students will need materials to conduct experiments. We have listed these in the lesson plan. We have also included a trip to the Leaburg Dam so that students can learn about dams and their uses. We plan on teaching this unit in the fall.

This is an extensive and very detailed chartmaker that allows students to create custom graphs/charts to analyze a variety of data. The default link compares life expectancy with average GDP per capita. There are educator resources with available lessons or use the tool in ways that work for your classroom instruction. This is one of the most detailed and extensive data tools available.

Gapminder Bubble Graph is a website with an interactive spatial and temporal datasets related to development, economics, demographics. These materials can work equally well for teacher-led or student-led activities.
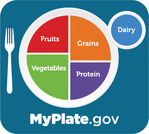
This is a unit of study that focuses on Healthy Lifestyles. Students will learn about healthy eating, sleep and exercise . They will track their data and set a goal to improve their health.