Is mud more than just wet dirt? Review this data and look …
Is mud more than just wet dirt? Review this data and look for any trends to determine relationships between organic matter and phosphorus in different muds.
Does the temperature affect plants flowering? Use this data to determine the …
Does the temperature affect plants flowering? Use this data to determine the answer to this question while looking for patterns and making predictions. Students can interact with the raw data from this experiement.
Discuss independent and independent variables as you learn about relationships between coral, …
Discuss independent and independent variables as you learn about relationships between coral, algae and urchins. Look for patterns and determine if there are any relationships between these different sea creatures by reading or creating your own graphical representations.
This course covers the design, construction, and testing of field robotic systems, …
This course covers the design, construction, and testing of field robotic systems, through team projects with each student responsible for a specific subsystem. Projects focus on electronics, instrumentation, and machine elements. Design for operation in uncertain conditions is a focus point, with ocean waves and marine structures as a central theme. Topics include basic statistics, linear systems, Fourier transforms, random processes, spectra, ethics in engineering practice, and extreme events with applications in design.
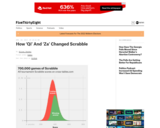
This learning video presents an introduction to the Flaws of Averages using …
This learning video presents an introduction to the Flaws of Averages using three exciting examples: the ''crossing of the river'' example, the ''cookie'' example, and the ''dance class'' example. Averages are often worthwhile representations of a set of data by a single descriptive number. The objective of this module, however, is to simply point out a few pitfalls that could arise if one is not attentive to details when calculating and interpreting averages. The essential prerequisite knowledge for this video lesson is the ability to calculate an average from a set of numbers. During this video lesson, students will learn about three flaws of averages: (1) The average is not always a good description of the actual situation, (2) The function of the average is not always the same as the average of the function, and (3) The average depends on your perspective. To convey these concepts, the students are presented with the three real world examples mentioned above.
This site teaches Statistics and Probability to 7th graders through a series …
This site teaches Statistics and Probability to 7th graders through a series of 475 questions and interactive activities aligned to 10 Common Core mathematics skills.
This site teaches Statistics and Probability to 8th graders through a series …
This site teaches Statistics and Probability to 8th graders through a series of 303 questions and interactive activities aligned to 5 Common Core mathematics skills.
This class activity is designed to introduce young learners to the concept …
This class activity is designed to introduce young learners to the concept of tree diagrams. This class activity requires learners to organize data about the individual student's physical characteristics(gender, hair and eye color) utilizing connecting cubes. The activity includes a follow up activity, questions, tips on getting started, a teacher resource page, and a printable version of the problem.
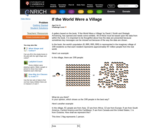
In this lesson activity students create visual representations for the data presented …
In this lesson activity students create visual representations for the data presented in the book, "If the World Were a Village" by David J Smith and Shelagh Armstrong. Students are challenged to create different representations and reason why one representation may be better than another. Suggested representations are pictographs, bar graphs, and tables. The activity includes the problem, teacher notes, hints, and solution suggestions.
This course provides graduate students in the sciences with an intensive introduction …
This course provides graduate students in the sciences with an intensive introduction to applied statistics. Topics include descriptive statistics, probability, non-parametric methods, estimation methods, hypothesis testing, correlation and linear regression, simulation, and robustness considerations. Calculations will be done using handheld calculators and the Minitab Statistical Computer Software.
This course covers descriptive statistics, the foundation of statistics, probability and random …
This course covers descriptive statistics, the foundation of statistics, probability and random distributions, and the relationships between various characteristics of data. Upon successful completion of the course, the student will be able to: Define the meaning of descriptive statistics and statistical inference; Distinguish between a population and a sample; Explain the purpose of measures of location, variability, and skewness; Calculate probabilities; Explain the difference between how probabilities are computed for discrete and continuous random variables; Recognize and understand discrete probability distribution functions, in general; Identify confidence intervals for means and proportions; Explain how the central limit theorem applies in inference; Calculate and interpret confidence intervals for one population average and one population proportion; Differentiate between Type I and Type II errors; Conduct and interpret hypothesis tests; Compute regression equations for data; Use regression equations to make predictions; Conduct and interpret ANOVA (Analysis of Variance). (Mathematics 121; See also: Biology 104, Computer Science 106, Economics 104, Psychology 201)
Introductory Statistics follows scope and sequence requirements of a one-semester introduction to …
Introductory Statistics follows scope and sequence requirements of a one-semester introduction to statistics course and is geared toward students majoring in fields other than math or engineering. The text assumes some knowledge of intermediate algebra and focuses on statistics application over theory. Introductory Statistics includes innovative practical applications that make the text relevant and accessible, as well as collaborative exercises, technology integration problems, and statistics labs.
This book is meant to be a textbook for a standard one-semester …
This book is meant to be a textbook for a standard one-semester introductory statistics course for general education students.Over time the core content of this course has developed into a well-defined body of material that is substantial for a one-semester course. The authors believe that the students in this course are best served by a focus on the core material and not by an exposure to a plethora of peripheral topics. Therefore in writing this book we have sought to present material that comprises fully a central body of knowledge that is defined according to convention, realistic expectation with respect to course duration and students maturity level, and our professional judgment and experience.
This problem presents students with a situation in which the probability of …
This problem presents students with a situation in which the probability of an event must be determined. Students make a prediction about the probability of Kaia's father wearing the same tie during one week and simulate the event with an experiment to confirm their prediction with the experimental probability. Additional resources for the teacher are provided along with a printable version of the problem.
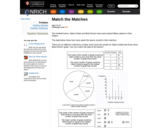
This data analysis activity requires students to read and interpret six written …
This data analysis activity requires students to read and interpret six written or graphical representations of data. Students must determine which graphs and analysis belong together. The data representations used include a pictograph, a circle graph, a frequency chart, a bar graph, and two written analyses including the terms mode, median, and mean for each data set. Included with the activity are teacher's notes, a hint, and the solution.
This is the first unit for the 7th-grade statistics lesson to cover …
This is the first unit for the 7th-grade statistics lesson to cover Mean, Median, Mode, and Range. It covers Utah Core Math Standards 7. S.P.1-2: Use random sampling to draw inferences about a population
No restrictions on your remixing, redistributing, or making derivative works. Give credit to the author, as required.
Your remixing, redistributing, or making derivatives works comes with some restrictions, including how it is shared.
Your redistributing comes with some restrictions. Do not remix or make derivative works.
Most restrictive license type. Prohibits most uses, sharing, and any changes.
Copyrighted materials, available under Fair Use and the TEACH Act for US-based educators, or other custom arrangements. Go to the resource provider to see their individual restrictions.