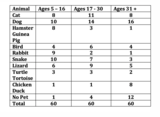
Students will use Numbers to create a bar graph with the data given. Students will then use Pages to make generalizations about the data.
- Subject:
- Secondary Mathematics
- Material Type:
- Homework/Assignment
- Author:
- Angela
- Date Added:
- 05/19/2021

Students will use Numbers to create a bar graph with the data given. Students will then use Pages to make generalizations about the data.

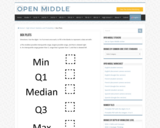
Open Middle provides math problems that have a closed beginning, a closed end, and an open middle. This means that there are multiple ways to approach and ultimately solve the problems. Open middle problems generally require a higher Depth of Knowledge than most problems that assess procedural and conceptual understanding.

This problem could be used as an introductory lesson to introduce group comparisons and to engage students in a question they may find amusing and interesting. More generally, the idea of the lesson could be used as a template for a project where students develop a questionnaire, sample students at their school and report on their findings.

The purpose of this task is to allow students to demonstrate an ability to construct boxplots and to use boxplots as the basis for comparing distributions. The solution should directly compare the center, spread, and shape of the two distributions and comment on the high outlier in the northbound data set.

At youcubed we are so excited to share this activity derived from a problem in Core-Plus Mathematics, Course 1. The problem included here is from Unit 3, Linear Functions, where students explore a small sample data set from the World Health Organization, Global Health Observatory Data Repository, faostat3.fao.org. We love the use of real data as students work, in this case, with linear functions and data.