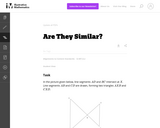
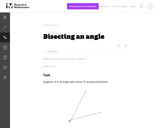
In this problem, students are given a picture of two triangles that …
In this problem, students are given a picture of two triangles that appear to be similar, but whose similarity cannot be proven without further information. Asking students to provide a sequence of similarity transformations that maps one triangle to the other focuses them on the work of standard G-SRT.2, using the definition of similarity in terms of similarity transformations.
This task provides a real world context for interpreting and solving exponential …
This task provides a real world context for interpreting and solving exponential equations. There are two solutions provided for part (a). The first solution demonstrates how to deduce the conclusion by thinking in terms of the functions and their rates of change. The second approach illustrates a rigorous algebraic demonstration that the two populations can never be equal.
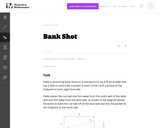
This task asks students to use similarity to solve a problem in …
This task asks students to use similarity to solve a problem in a context that will be familiar to many, though most students are accustomed to using intuition rather than geometric reasoning to set up the shot.
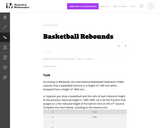
This task involves a fairly straightforward decaying exponential. Filling out the table …
This task involves a fairly straightforward decaying exponential. Filling out the table and developing the general formula is complicated only by the need to work with a fraction that requires decisions about rounding and precision.
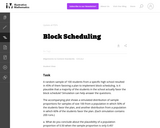
This task presents a simple but mathematically interesting game whose solution is …
This task presents a simple but mathematically interesting game whose solution is a challenging exercise in creating and reasoning with algebraic inequalities. The core of the task involves converting a verbal statement into a mathematical inequality in a context in which the inequality is not obviously presented, and then repeatedly using the inequality to deduce information about the structure of the game.
In this task, output is given from a computer-generated simulation, generating size-100 …
In this task, output is given from a computer-generated simulation, generating size-100 samples of data from an assumed school population of 2000 students under hypotheses about the true distribution of yes/no voters.
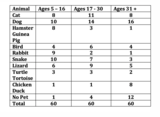
The purpose of this task is to assess a student's ability to …
The purpose of this task is to assess a student's ability to compute and interpret an expected value. Notice that interpreting expected value requires thinking in terms of a long-run average.
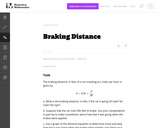
This task provides an exploration of a quadratic equation by descriptive, numerical, …
This task provides an exploration of a quadratic equation by descriptive, numerical, graphical, and algebraic techniques. Based on its real-world applicability, teachers could use the task as a way to introduce and motivate algebraic techniques like completing the square, en route to a derivation of the quadratic formula.
No restrictions on your remixing, redistributing, or making derivative works. Give credit to the author, as required.
Your remixing, redistributing, or making derivatives works comes with some restrictions, including how it is shared.
Your redistributing comes with some restrictions. Do not remix or make derivative works.
Most restrictive license type. Prohibits most uses, sharing, and any changes.
Copyrighted materials, available under Fair Use and the TEACH Act for US-based educators, or other custom arrangements. Go to the resource provider to see their individual restrictions.