An article based on data and evidence that includes charts and information that can be analyzed statistically by students.
- Subject:
- Mathematics
- Material Type:
- Data Set
- Provider:
- FiveThirtyEight
- Date Added:
- 10/24/2022

An article based on data and evidence that includes charts and information that can be analyzed statistically by students.
An article based on data and evidence that includes charts and information that can by analyzed statistically by students.
An article based on data and evidence that includes charts and information that can be analyzed statistically by students.

HereÕs one to make into a puzzle. Print, cut and have some fun! Or take the next challenge and construct (draw) your own!

Our friends at the Monterey Bay Aquarium Research Institute have created an interesting task where they share data they collected from Blue Whales. We send many thanks to the MBARI scientists and the American Museum of Natural History for creating and posting these wonderful resources. This collection of videos, text passages and interactive data graphs will light up minds as students explore data that has been collected to explain what goes on when a Blue Whale is under the surface of the ocean.

This problem requires children to think about factors and multiples and, in particular, common factors, but it is not necessary for them to have met this term prior to having a go at the task. It offers opportunities for pupils to ask their own questions, find examples, make conjectures and begin to generalize.
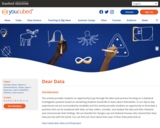
This activity provides students an opportunity to go through the data cycle process focusing on a statistical investigative question based on something students would like to learn about themselves. In our day-to-day experiences we are surrounded by variability and this activity provides students an opportunity to formulate a question that can be answered with data, as they collect, consider, and analyze the data and then interpret and communicate their findings. We are thankful for Giorgia Lupi and Stefanie Posavec who shared their Dear Data journey with the world.

Many students in the US think of Pi as a number they should memorize, when the most important idea for students to learn is that Pi is a very cool relationship, that exists inside all circles in the world. In this task students will find that relationship themselves, through cutting and folding, and be asked to reflect on it.

This has become one of our most popular tasks and we are hearing about all sorts of creative adaptations. Some youcubians have made grids of 400 and added dice, others have adapted it to let the grid represent 100%. Please post how you use this task with your students.
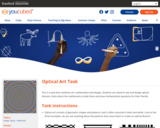
This is a task that combines art, mathematics and design. Students are asked to see and design optical illusions, think about the mathematics inside them and pose mathematical questions for their friends.
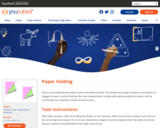
This is a youcubed favorite which comes from Mark Driscoll. The activity encourages students and teachers to engage in visual, creative thinking. We have coupled MarkÕs activity with asking students to reason and be convincing, two important mathematical practices.

My heart is always with youcubed. HereÕs a tessellation of our logo!