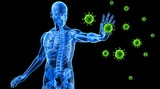
Students will construct a model of a cell in order to identify …
Students will construct a model of a cell in order to identify organelles and their function as they build an understanding of the increasing complexity of tissues, organs, organ systems, and organisms.
Science Phenomena: HS Physical Science - Forces and Interactions - The coupled …
Science Phenomena: HS Physical Science - Forces and Interactions - The coupled pendulum can be created with either string or a spring connecting the two pendulums. With each swing energy is transferred from one pendulum to the other. If the pendulums both have the same length one pendulum comes to a complete stop before alternating motion. This phenomenon can be used to show balanced and unbalanced forces, how motion can be used to predict future motion, and the conservation of energy.
Have you ever wondered where we are in our own galaxy, Milky …
Have you ever wondered where we are in our own galaxy, Milky Way? "Glitter Your Milky Way" let you get creative while learning the characteristics of the Milky Way and exploring the types of galaxies.
This resource will teach the basic shapes needed to create a lion …
This resource will teach the basic shapes needed to create a lion head drawing. The video will give step-by-step instruction on how to create the lion head.
Welcome to How to Solve One-Step Equations with Mr. J! Need help …
Welcome to How to Solve One-Step Equations with Mr. J! Need help with one-step equations? You're in the right place!Whether you're just starting out, or need...
This infographic offers an overview of how confirmation bias and motivated reasoning …
This infographic offers an overview of how confirmation bias and motivated reasoning impact our beliefs and outlines some key tips on how to best defend ourselves against cognitive biases. Confirmation bias is an innate, unconscious tendency to interpret information in ways that confirm what we already believe — or want to believe. Similar to confirmation bias, motivated reasoning occurs when someone actively looks for reasons why they’re right and rejects facts and research that don’t fit their beliefs. And confirmation bias can actually cause people to engage in motivated reasoning.
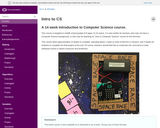
A 14 week Introduction to Computer Science course. This course is targeted …
A 14 week Introduction to Computer Science course. This course is targeted to middle school grades 6-8 (ages 11-14 years). It is also written for teachers who may not have a Computer Science background, or who may be teaching an “Intro to Computer Science” course for the first time.
This course takes approximately 14 weeks to complete, spending about 1 week on each of the first 11 lessons, and 3 weeks for students to complete the final project at the end. Of course, teachers should feel free to customize the curriculum to meet individual school or district resources and timeframe.
The Knoster Model was created by Tim P. Knoster, Ed.D., professor at …
The Knoster Model was created by Tim P. Knoster, Ed.D., professor at the McDowell Institute for Teacher Excellence in Positive Behavior Support in the College of Education at Bloomsburg University of Pennsylvania. The model is the result of years of rigorous behavioral science research and testing. The Knoster Model defines six elements that must be addressed to affect desired change. This model can be used as a resource and guide for applying theories of change at a systemic level.
Smithsonian resource. This collection of 5 videos visually tells the story of …
Smithsonian resource. This collection of 5 videos visually tells the story of 5 labor leaders and how they worked to ensure safer working conditions, better wages, and how they brought forth state and federal legislation with their work.
This brief article describes the number sequence of Leonardo of Pisa (Fibonacci), …
This brief article describes the number sequence of Leonardo of Pisa (Fibonacci), and its connecton to the golden ratio and rectangle. Links to related topics and a link to a printable page are included.
This infographic presents eight distinct levels of scientific evidence arranged in a …
This infographic presents eight distinct levels of scientific evidence arranged in a pyramid that reflects a spectrum of quality. Levels of evidence at the bottom are significantly more prone to error and bias than those at the top. The pyramid is reflective of the process of science itself: as initial hypotheses about a given question are tested, they are either disproven and discarded or they survive to be tested further. As more rigorous studies are completed, and as their results are compiled and analyzed, the picture painted by the evidence becomes clearer and more compelling.
This is the slide presentation used for the Leveraging Technology to Build …
This is the slide presentation used for the Leveraging Technology to Build Collective Efficacy session at UCET 2024. Attendees will learn how to define collective efficacy, examine current practices that build collective efficacy, and how to leverage technology to build collective efficacy.
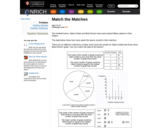
This data analysis activity requires students to read and interpret six written …
This data analysis activity requires students to read and interpret six written or graphical representations of data. Students must determine which graphs and analysis belong together. The data representations used include a pictograph, a circle graph, a frequency chart, a bar graph, and two written analyses including the terms mode, median, and mean for each data set. Included with the activity are teacher's notes, a hint, and the solution.
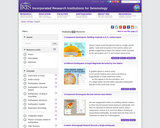
The Coherence Map from AchieveTheCore.org maps out the Common Core mathematics standards …
The Coherence Map from AchieveTheCore.org maps out the Common Core mathematics standards in a tree format. Select any math standard and see the prerequisite standards as well as what it is a prerequisite for. Each standard has attached tasks, progressions, and assessments.
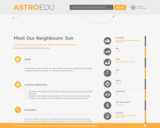
Converting the visual to tactile experience, this activity let visually impaired students …
Converting the visual to tactile experience, this activity let visually impaired students to learn and explore about our star, Sun, and its main characteristics.
Smithsonian resource. Multiple short videos show how American scientists and innovators were …
Smithsonian resource. Multiple short videos show how American scientists and innovators were prominent in the 1800s and their contributions to society.
No restrictions on your remixing, redistributing, or making derivative works. Give credit to the author, as required.
Your remixing, redistributing, or making derivatives works comes with some restrictions, including how it is shared.
Your redistributing comes with some restrictions. Do not remix or make derivative works.
Most restrictive license type. Prohibits most uses, sharing, and any changes.
Copyrighted materials, available under Fair Use and the TEACH Act for US-based educators, or other custom arrangements. Go to the resource provider to see their individual restrictions.