An article based on data and evidence that includes charts and information that can be analyzed statistically by students.
- Subject:
- Mathematics
- Material Type:
- Data Set
- Provider:
- FiveThirtyEight
- Date Added:
- 10/24/2022

An article based on data and evidence that includes charts and information that can be analyzed statistically by students.

This site is designed to help students, parents, counselors and others find information on more than 7,000 colleges and universities.

Helps students calculate the net price of any college program.

Developed by the U.S. Department of Education and Transparency Center, this tool is geared toward helping students find a college that is a good fit for them.

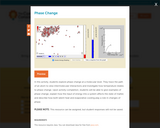
This interactive activity for grades 8-12 features eight models that explore atomic arrangements for gases, solids, and liquids. Highlight an atom and view its trajectory to see how the motion differs in each of the three primary phases. As the lesson progresses, students observe and manipulate differences in attractions among atoms in each state and experiment with adding energy to produce state changes. More advanced students can explore models of latent heat and evaporative cooling. This item is part of the Concord Consortium, a nonprofit research and development organization dedicated to transforming education through technology.

Research indicates that most standards documents articulate far more content than can be taught in the time available to K–12 teachers. In response, analysts at Marzano Resources sought to identify, as objectively as possible, a focused set of critical concepts for each K–12 grade level in the content areas of English language arts (ELA), mathematics, science, and social studies.

Is there life on other planets? Use this data set to determine what you think. Students create line graphs and compare the different crystals.

Create scatter plots to help you determine the effect a flood may have on the fish that are in a river. Raw data is available for this experiment.

"Do plants from different climates show differences in chemical diversity as a result of herbivory defense?" Answer this question with your abiltiy to work with statistics.

Which scorpion will the mice choose to eat? Review this data to determine if it was the painless scorpion or not.

Students use their knowledge of statistics to answer the question, "How does the Atlantic white cedar respond to changing temperature?"

How does strength of a male horned dung beetle affect its chances at winning a fight? Look at this data and see what you think.

"Does the amount of time lady beetles spend at freezing temperatures affect how long it takes for them to wake up from a chill coma?" Use this data nugget and your graphing skills to determine a solution.

Answer the following question by creating a scatterplot. "Are firefly populations in Southwest Michigan in decline?"

Create a scatterplot and look for trends to answer the question, "How does seed viability change over time?"

Work with weighted averages and bar graphs while learning what Forensic entomology is.

Use the data to see if you can answer the question, "Is there evidence that the Saratoga Creek restoration in 1999 was successful at reducing the Phragmites invasion?"

Students will learn about coral bleaching and climate change while setting up ratios, analyzing and making predictions using the data.

Use the data to find your answer to the question, "Are there differences in the appearance of mustard hill coral and thin finger coral that live in coral reef and mangrove forest habitats?"

Use this data about shy and bold fish to talk about statistics in a real situation while emphasizing percents and making predictions and graphs.