
Section Two: Teacher Edition - Learning Tasks and Cognitive Rigor
- Subject:
- Mathematics
- Secondary Mathematics
- Material Type:
- Textbook
- Date Added:
- 09/18/2019

Section Two: Teacher Edition - Learning Tasks and Cognitive Rigor

In this lesson designed to enhance literacy skills, students learn how to read and interpret a distance–time graph.

Students are introduced to graphing on the coordinate plane, in the first quadrant, using (x, y) coordinates.
This task addresses an important issue about inverse functions. In this case the function f is the inverse of the function g but g is not the inverse of f unless the domain of f is restricted.
This task requires students to recognize the graphs of different (positive) powers of x. There are several important aspects to these graphs. First, the graphs of even powers of x all open upward as x grows in the positive or negative direction. The larger the even power, the flatter these graphs look near 0 and the more rapidly they increase once the distance of x from 0 excedes 1.
This task is designed to make students think about the meaning of the quantities presented in the context and choose which ones are appropriate for the two different constraints presented. In particular, note that the purpose of the task is to have students generate the constraint equations for each part (though the problem statements avoid using this particular terminology), and not to have students solve said equations.
This is a challenging task, suitable for extended work, and reaching into a deep understanding of units. The task requires students to exhibit MP1, Make sense of problems and persevere in solving them. An algebraic solution is possible but complicated; a numerical solution is both simpler and more sophisticated, requiring skilled use of units and quantitative reasoning. Thus the task aligns with either A-CED.1 or N-Q.1, depending on the approach.
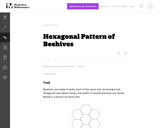
The goal of this task is to use geometry study the structure of beehives. Beehives have a tremendous simplicity as they are constructed entirely of small, equally sized walls. In order to as useful as possible for the hive, the goal should be to create the largest possible volume using the least amount of materials. In other words, the ratio of the volume of each cell to its surface area needs to be maximized. This then reduces to maximizing the ratio of the surface area of the cell shape to its perimeter.
In this task students must interpret a function in relation to a given problem.
The purpose of this task is to assess understanding of how study design dictates whether a conclusion of causation is warranted. This study was observational and not an experiment, which means that it is not possible to reach a cause-and-effect conclusion.
Highlights of Calculus is a series of short videos that introduces the basics of calculus—how it works and why it is important. The intended audience is high school students, college students, or anyone who might need help understanding the subject.

This task is designed as an assessment item. It requires students to use information in a two-way table to calculate a probability and a conditional probability. Although the item is written in multiple choice format, the answer choices could be omitted to create a short-answer task.
The purpose of this task is for students to apply the concepts of mass, volume, and density in a real-world context. There are several ways one might approach the problem, e.g., by estimating the volume of a person and dividing by the volume of a cell.
This is a mathematical modeling task aimed at making a reasonable estimate for something which is too large to count accurately, the number of leaves on a tree.
In this problem, the variables a,b,c, and d are introduced to represent important quantities for this esimate: students should all understand where the formula in the solution for the number of leaves comes from. Estimating the values of these variables is much trickier and the teacher should expect and allow a wide range of variation here.
Pennies have a monetary face value of one cent, but they are made of material that has a market value that is usually different. It is the value of the materials that requires attention in this problem. While it is interesting to compare the face value with the value of the materials, this does not have any bearing on the calculations. Interference between these two notions of value is a possible area of difficulty for some students.
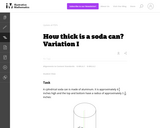
As written, this problem gives students all of the information they need to estimate the thickness of a soda can.
his is a version of ''How thick is a soda can I'' which allows students to work independently and think about how they can determine how thick a soda can is. The teacher should explain clearly that the goal of this task is to come up with an ''indirect'' means of assessing how thick the can is, that is directly measuring its thickness is not allowed.
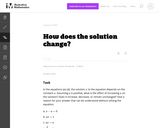
The purpose of this task is to continue a crucial strand of algebraic reasoning begun at the middle school level (e.g, 6.EE.5). By asking students to reason about solutions without explicily solving them, we get at the heart of understanding what an equation is and what it means for a number to be a solution to an equation. The equations are intentionally very simple; the point of the task is not to test technique in solving equations, but to encourage students to reason about them.
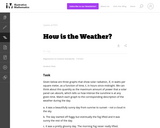
This task can be used as a quick assessment to see if students can make sense of a graph in the context of a real world situation. Students also have to pay attention to the scale on the vertical axis to find the correct match.